Interdisciplinary Green Roof Research Group
|
|
Interdisciplinary Green Roof Research Group |
||||
| Home | About | Members | Research | Publications | Links |
| TAMU Green Roof Research | |
 |
|
| Methods | |
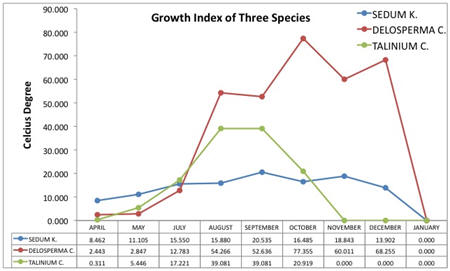
(1) Temperature In order to examine the cooling effect of green roofs, temperatures were measured on the existing membrane of Langford A, the surface of the green roofs and the temperatures just below the modules. To measure temperature, twelve modular green roof trays were set up on top of the Langford Architecture Center, a four-story building on the campus of Texas A&M University. Campbell Scientific temperature probes were purchased and installed. We estimated temperatures at six locations including Green Roof A (green roof surface), Green Roof B (below the green roof) , Soil A (soil at the surface), Soil B (soil beneath) , Roof temperature, and Ambient temperature. Through the comparative analysis, we examined the cooling effect of the green roof modules. (2) Storm Water Twelve Texas Instruments TE525L rain buckets were purchased and installed. One Met One 325 rain gauge was donated through the Texas A&M Department of Atmospheric Sciences. The rain buckets will measure the volume and rate of water leaving the green roof modules. (3) Plants We calculated the GI (growth index) of the three species by measuring the extent of their growth once a month, except for April through May where measurements were taken at 45 days. After the beginning of May, measurements were recorded every 30 days. This figure shows the GI for each of the three species investigated. In this research, we introduce the growth index in order to examine the growth of the species. The growth index is defined as following:
Where, H= height of plant canopy; W= width of plant canopy; P= percentage of canopy occupying the diameter of W. . Plant growth measurements were recorded monthly for each species and each plant in order to determine the growth index. |
|
| Plant Investigations | |
|
We calculated the GI (growth index) of the three species by measuring the extent of their growth once a month, except for April, and early May. After the beginning of May, measurements were recorded monthly. This figure shows the GI of three species. Considering maximum growth, Delosperma cooperii was the top performer. Its GI is larger than others during August to December and its total increase of growth was the greatest among them. Conversely, Sedum Kamtschaticum’s GI was the smallest through the growing season. We lost 60% of the species across the three modules. The remaining species are now healthy and seem to be fine. Talinum calycinum had grown vigorously during May to October, however it shut down during the fall. The Talinum bloomed throughout the summer and excelled during extremely hot and dry periods without any signs of stress. Talinum could be considered a companion species in green roof design, since it has a limited but very productive growth pattern. All plants shut down and entered a dormant stage after the sustained cold temperatures during December 2009 and January 2010. (Dvorak, B., Volder, A., A Green Roof Pilot Study at the Texas A&M Architecture Center Langford Building A- Final Report, January 29, 2010) |
|
| Stromwater Volume Reduction | |
|
Preliminary data collected during a February thunderstorm indicates that 51% of the 0.4” rainfall was retained by the green roof modules. The Talinum and Sedum were dormant and the media had several days to dry out prior to the previous rain event. (individual report) |
|
| Stormwater Quality | |
|
Coming soon. |
|
| Cooling Effect | |
|
|
|
|
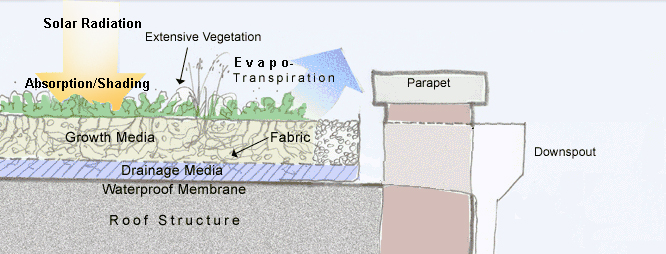
Green roof components and their influence on environmental cooling (diagram by B. Dvorak) |
|
|
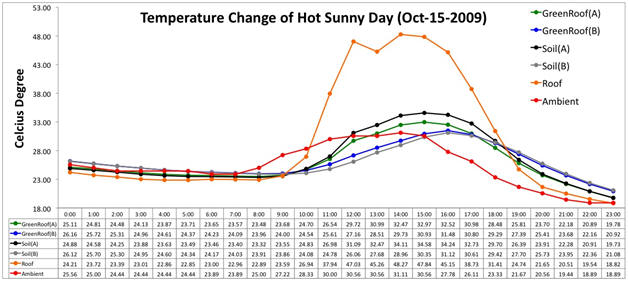
Figure 1 below shows the effect of ambient temperature during the 24 hour period of a hot sunny day (October 15th). Sunny days produced the greatest increase in surface temperature of the existing roof as well as the green roof module. However, temperatures of green roof (A) were lower than that of control group soil (A) during daytime hours from about 10:00 to 18:00. Even though the two temperatures are higher than the ambient temperature, the Figure 1 shows that the green roof has a positive cooling effect on surface and subsurface temperatures. Also, regardless of green roof and control group, the green roof trays have a tendency to have lower temperatures than the control roof during the daytime.
Figure 1 Temperature Change of Hot Sunny Day (Oct. 15 2009) for a 24 hour period
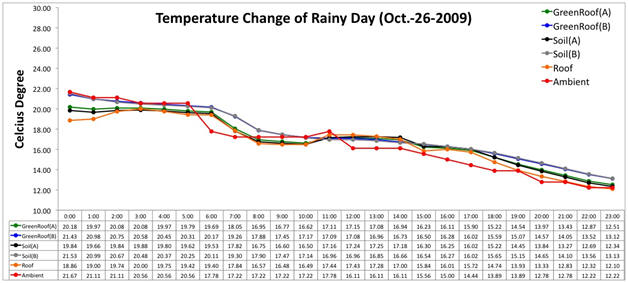
Figure 2 below shows the effect of ambient temperature during a warm rainy day (October 26th). Unlike sunny hot days, warm rainy days do not cause the intense increase in surface temperature of the existing roof. Therefore green roofs may provide most benefit in hot sunny climates and warm or hot cloudy or rainy climates may have less temperature reduction benefit.
Figure 2 Temperature Change during a Warm Rainy Day (Oct. 26 2009) for a 24 hour period (Dvorak, B., Volder, A., A Green Roof Pilot Study at the Texas A&M Architecture Center Langford Building A- Final Report, January 29, 2010) |